Google Stackdriver has thousands of build-in metrics to monitor everything from Kubernetes cluster to database or storage. Stackdriver is also not just limited to Google Cloud Platform (GCP), it supports a number of AWS-native services and extensive log monitoring capabilities for a wide array of open source software packages, whether they run in the Cloud or in on premises.
Custom Metrics
When developing a solution though, in addition to monitoring the infrastructure and software, you may also want to monitor internal application events, like throughput of specific types of events, multi-step transaction duration or a total end-to-end pipeline performance.
To enable this kind of granular and custom monitoring, Stackdriver supports custom metrics. While it’s possible to write those metrics directly against Stackdriver metricDescriptors API, it’s much easier to use the native Client libraryy support provided by Stackdriver in many development languages (C#, GO, Java, Node.js, PHP, Python, Ruby).
Producer
For illustration purposes, let’s assume you want to track special type of messages in your solution.
dataPoint := &monitoringpb.Point{
    Interval: &monitoringpb.TimeInterval{
        EndTime: &googlepb.Timestamp{ Seconds: time.Now().Unix() },
    },
    Value: &monitoringpb.TypedValue{
        Value: &monitoringpb.TypedValue_Int64Value{ Int64Value: m },
    },
}
The Stackdriver libraries strongly type the metric (in this case Int64). Also, while normally you will include the timestamp of the time when the event was collected, for simplicity this example we will generate it at sending time.
Your solution is distributed so in addition to the data point, we will also want to send the event source for each one of the events to allow us to attribute each event source individually.
tsRequest := &monitoringpb.CreateTimeSeriesRequest{
    Name: monitoring.MetricProjectPath(projectID),
    TimeSeries: []*monitoringpb.TimeSeries{
        {
            Metric: &metricpb.Metric{
                Type: customMetricType,
                Labels: map[string]string{ "instance_id": sourceID },
            },
            Resource: &monitoredrespb.MonitoredResource{
                Type: "global",
                Labels: map[string]string{ "project_id": projectID},
            },
            Points: []*monitoringpb.Point{dataPoint},
        },
    },
}
Once the payload is prepared, the producer can send it to StackDriver API using a simple command
if err := monitorClient.CreateTimeSeries(appContext, tsRequest); err != nil {
    log.Printf("Failed to write time series data: %v", err),
}
The complete sample of code for the producer along with Dockerfile to build and publish into your Kubernetes cluster is available in this GitHub repository.
Monitoring (Dashboard)
The quickest way to inspect your newly submitted metrics is the StackDriver dashboard. Simply add new chart using the “Custom Metrics” resource type.
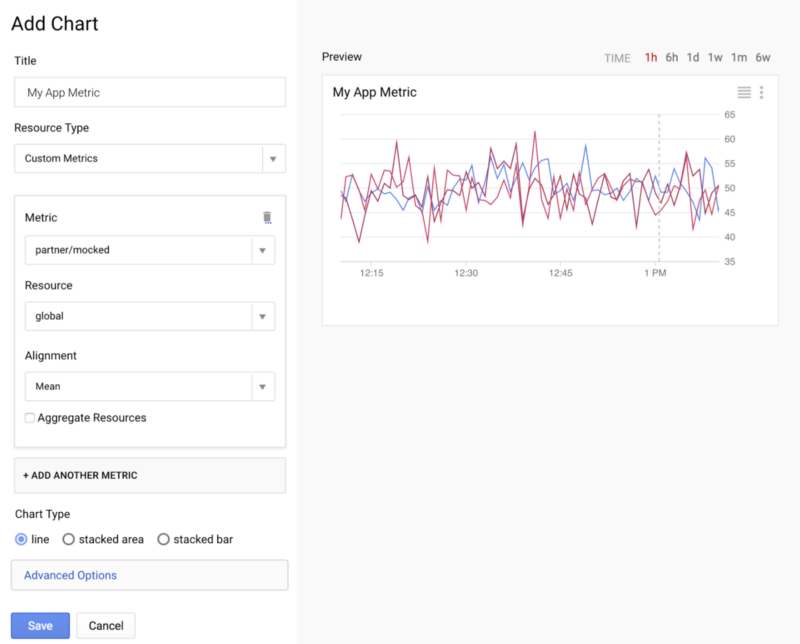
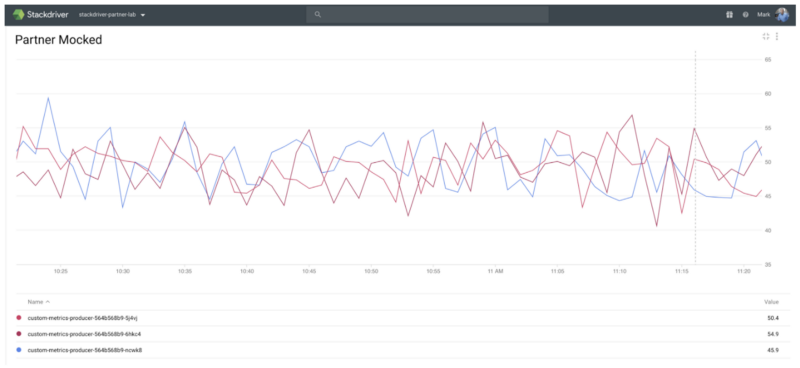
Once saved this custom metrics appear as a chart. If you have not chosen to aggregate the metric data, each source will be represented individually.
Incident Management
Besides generating nice charts, the StackDriver data is also actionable. You can create notification policy with number of common incident management target options (e.g. PagerDuty, SMS, or Slack) as well as any publically accessible Webhook.
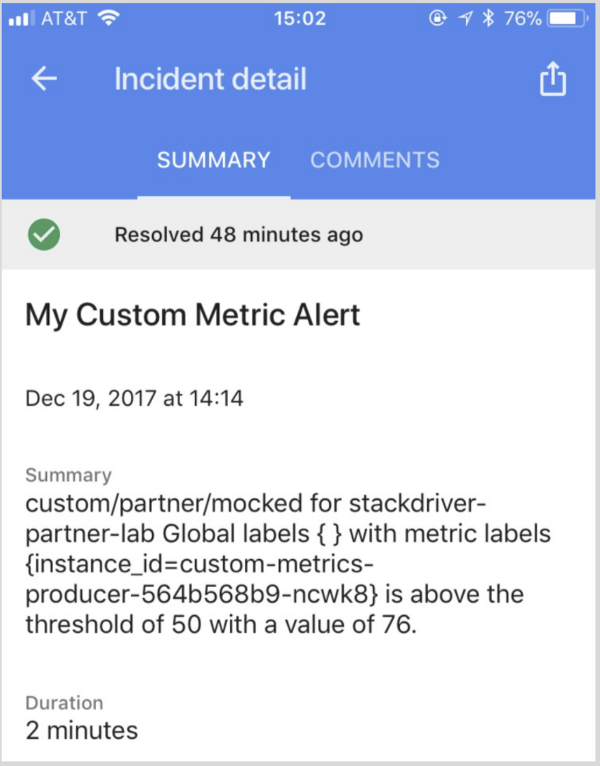
Simply define a conditions that identify an unhealthy state for a resource or a group of resources, (in our case the custom metric), and create/define notification target which will be notified to let you know when the resource is unhealthy.
The one notification target I “enjoy” the most is the Cloud Console Mobile App which is available for both Android and iOS. Using the mobile app you can monitor your GCP Console resources and Stackdriver information.
You can find the source code and how to for this post on GitHub.