If you are doing any vulnerability detection in your software release pipeline today, you are already familiar with the volumes of data these scanners can generate. That dataset gets significantly larger when you add things like license scanning and Software Bill of Materials (SBOM) generation. That volume of data gets further compounded with each highly-automated pipeline you operate. This can quickly lead to what I refer to as a Software Supply Chain Security (S3C) data fatigue, as many vulnerabilities you’ll discover you simply can’t do anything about. There is an actionable signal in there actually, it’s just hard to find it in the midst of all the noise.
Over the last year, there has been a growing number of existing and new security focused ISVs who are starting to now provide integrated products to help you management of all this data and offer algorithms to automate the discovery (e.g. Chainguard, Mend, Synopsys, Sonatype, Snyk). In GCP, we’ve also added Container Analysis API to enable metadata management.
To learn more about S3C data, and to better understand the challenges in this space, I’ve put together a simple solution called disco to:
- Continuously discover container images used in my workloads across multiple GCP projects, regions, and runtimes
- Easily plug different open source image scanners (e.g. syft and trivy for SBOM, grype, osv-scanner, snyk, and trivy for vulnerabilities, and some combination of each of these for licenses)
- Automatically manage data exports for:
- Raw scanner reports into GCS bucket
- Key data feature metrics into Cloud Monitoring time-series
- Synthesized data into BigQuery tables
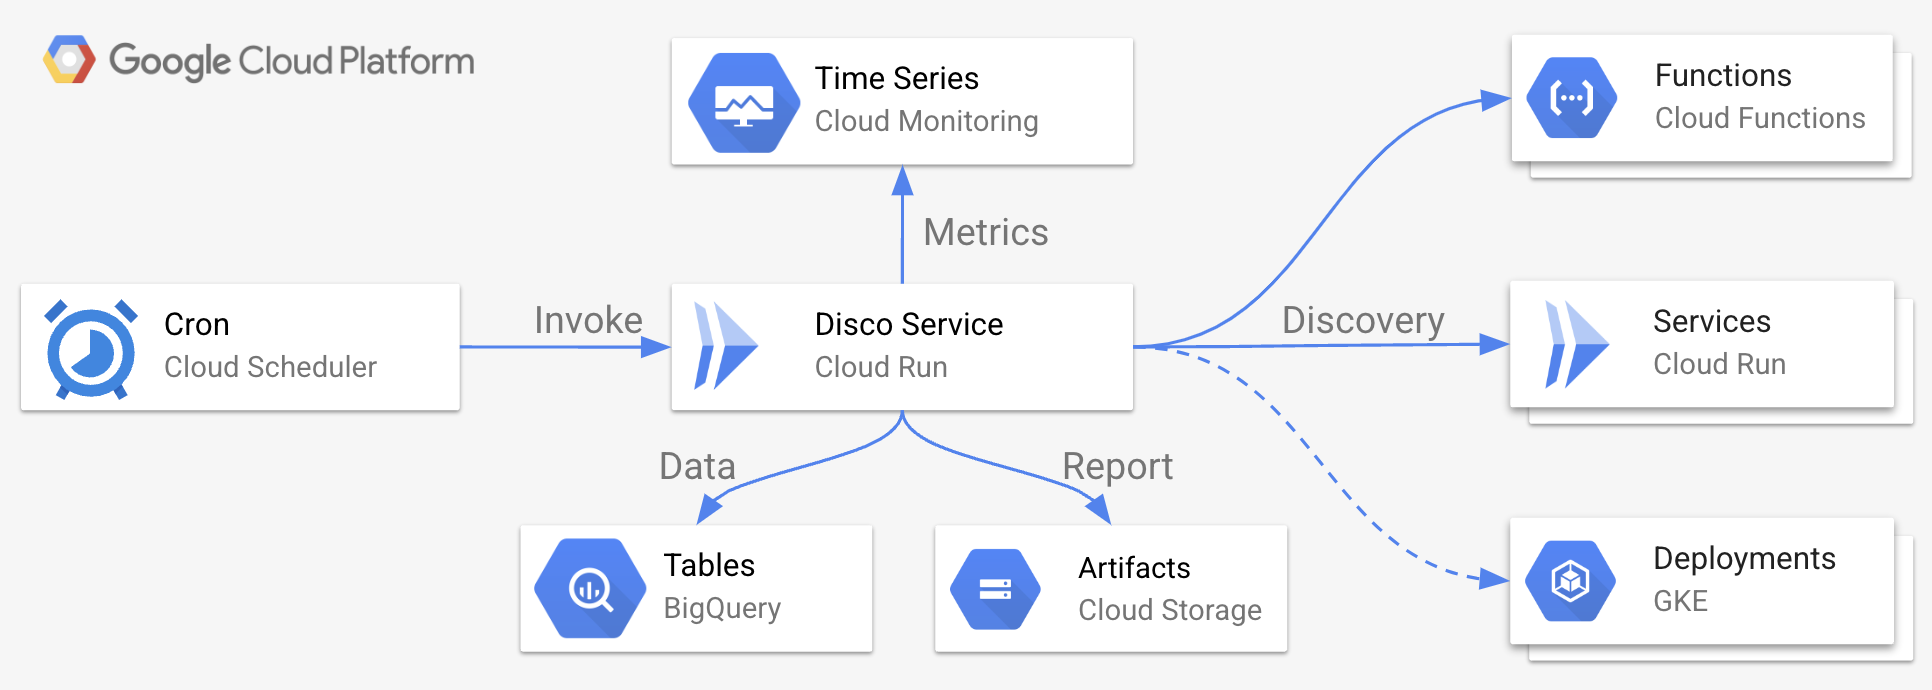
Here is a high-level topology of the disco solution:
The four challenges I’ve been thinking about in relation to the above-described S3C data noise, along with a simple pragmatic approaches I wanted to evaluate are:
- Large number of data sources (i.e. many images with many versions in container registry, which ones are actually used?) - Scope sources down to only what’s actually being used at any given time to underpin the live services. Ideally the discovery shifts left and integrates into release pipeline, but, if the release frequency is not high (order of days, or more), this may be valuable addition, as new vulnerabilities are discovered all the time (i.e. Day 0).
- Multiple data formats (i.e. SPDX, CycloneDX, which version?) - Normalize the data into a consistent set that maps the key identities (e.g. packages, files, relationships, licenses, vulnerabilities, etc.), across multiple formats.
- Hard to parse signal in raw data (hard to reason over values in JSON or YAML file) - Identify key features and automate metering to create a change detection system to focus on significant events using threshold rules scoped to a project, deployment, runtime, image, or even single package.
- Point-in-time perspective (hard to compare multiple sources or capture deviation over time) - Enable forensic (historical) analysis over data spanning longer periods of time to detect trends and potential gaps using commonly known skills and technologies (e.g. SQL) to enable a broader number of reporting tools and audiences.
Here is how I’ve implemented each one of these approaches and what I have learned in the process:
Image Discovery
To find images that are being actively used in live services I’ve written a simple Go client. That client queries the GCP API for projects, and traverses the active deployments in each runtime to find the specific image digest. This is basically equivalent to this gcloud commands like this:
curl -H "Content-Type: application/json; charset=utf-8" \
     -H "Authorization: Bearer $(gcloud auth application-default print-access-token)" \
     "https://cloudresourcemanager.googleapis.com/v1/projects"
The project, regions, runtimes, and service that client discovers are automatically scoped to the identity under which the disco service operates. This makes it easy to manage cross-project discovery using IAM roles.
New services are deployed all the time, so the disco service uses a cron job in Cloud Scheduler to continuously execute the discovery service (defaults to hourly). Technically, each new deployment in these runtimes has a corresponding event in Eventarc, so ad-hoc scans for newly updated services are possible. Still, to keep things simple, disco operates in batches.
The actual digest that underpins the live service in Cloud Run is stored on the revision, and Cloud Run can split traffic across multiple revisions. To deal with this, disco uses API filters and traverses the revisions to identify all of the “active” ones. Also, while somewhat counter-intuitive, Cloud Functions does actually build images behind the scene when you deploy a new function. These are managed by GCP, so the GCF API doesn’t expose the actual digest, but it does provide the revision ID, which can be used against the Cloud Run API to discover the actual digest.
Data Normalization
To extract data from each one of the discovered images, disco uses one of the preconfigured open source scanners. These scanners generate reports which disco then uses to extract three main entities:
Packages
SBOM file generated by scanner (default: SPDX v2.2 using trivy although I have experimented with the other formats I found in the set the Chainguard team maintains in their (s)bom-shelter). The disco mapping is mostly flattened ‘.packages’ data with file level metadata. I’ve started experimenting with traversing the ‘.relationships’ graph but this turned out to be a lot more complicated than I expected, and didn’t really add that much value to the simple use-case I was after. (I’d like to integrate GUAC here in the future to normalizing entity identities via mapping standard relationships using graph DB)
Vulnerabilities
From a vulnerability report generated by one of the OSS scanners (default: Trivy) for all layers in each image (SPDX v3.0 will include vulnerability data, so this will remove the need for additional scans and different parsers. For now though, the subset of packages with vulnerabilities need to be mapped to all of the packages found in the image. I’ve also started to look into the CVSS scores from different vendors, but still have much to learn about the lifecycle and implications of these so for now just using the “simple” severity
Licenses
From OS and package license report used in each image using an OSS scanner (default: trivy). Technically, you could pull the license information from SBOM, but the dataset in the explicit report is more complete and I was able to avoid the whole “declared” (by vendor) vs “concluded” dance. Trivy also provides a “confidence” indicator which helps in downstream analysis
Once extracted, in addition to all the other data, disco also normalizes the shape of the key elements for all of these identities to enable cross-reference:
- BatchID - single ID for the entire batch to make deduplication easier
- ImageURI - image URI (without tag or sha) for queries spanning multiple versions
- ImageSHA - image sha to ensure unique identity for specific image version
- Package - fully qualified package name
- PackageVersion - canonical version of the package
- Updated - timestamp when the data element was extracted
Metrics Export
Even with only a small number of services across a couple of runtimes, disco will quickly generate thousands of data points. To ensure that the meaningful signal is detected early, disco exports custom metrics from each scan, for example:
- disco/vulnerability/severity - vulnerability count for each severity (labels: severity value, project, service, runtime, image)
- disco/license/image - licenses per image (labels: license kind, project, service, runtime)
- disco/package/image - packages per image (labels: project, service, runtime)
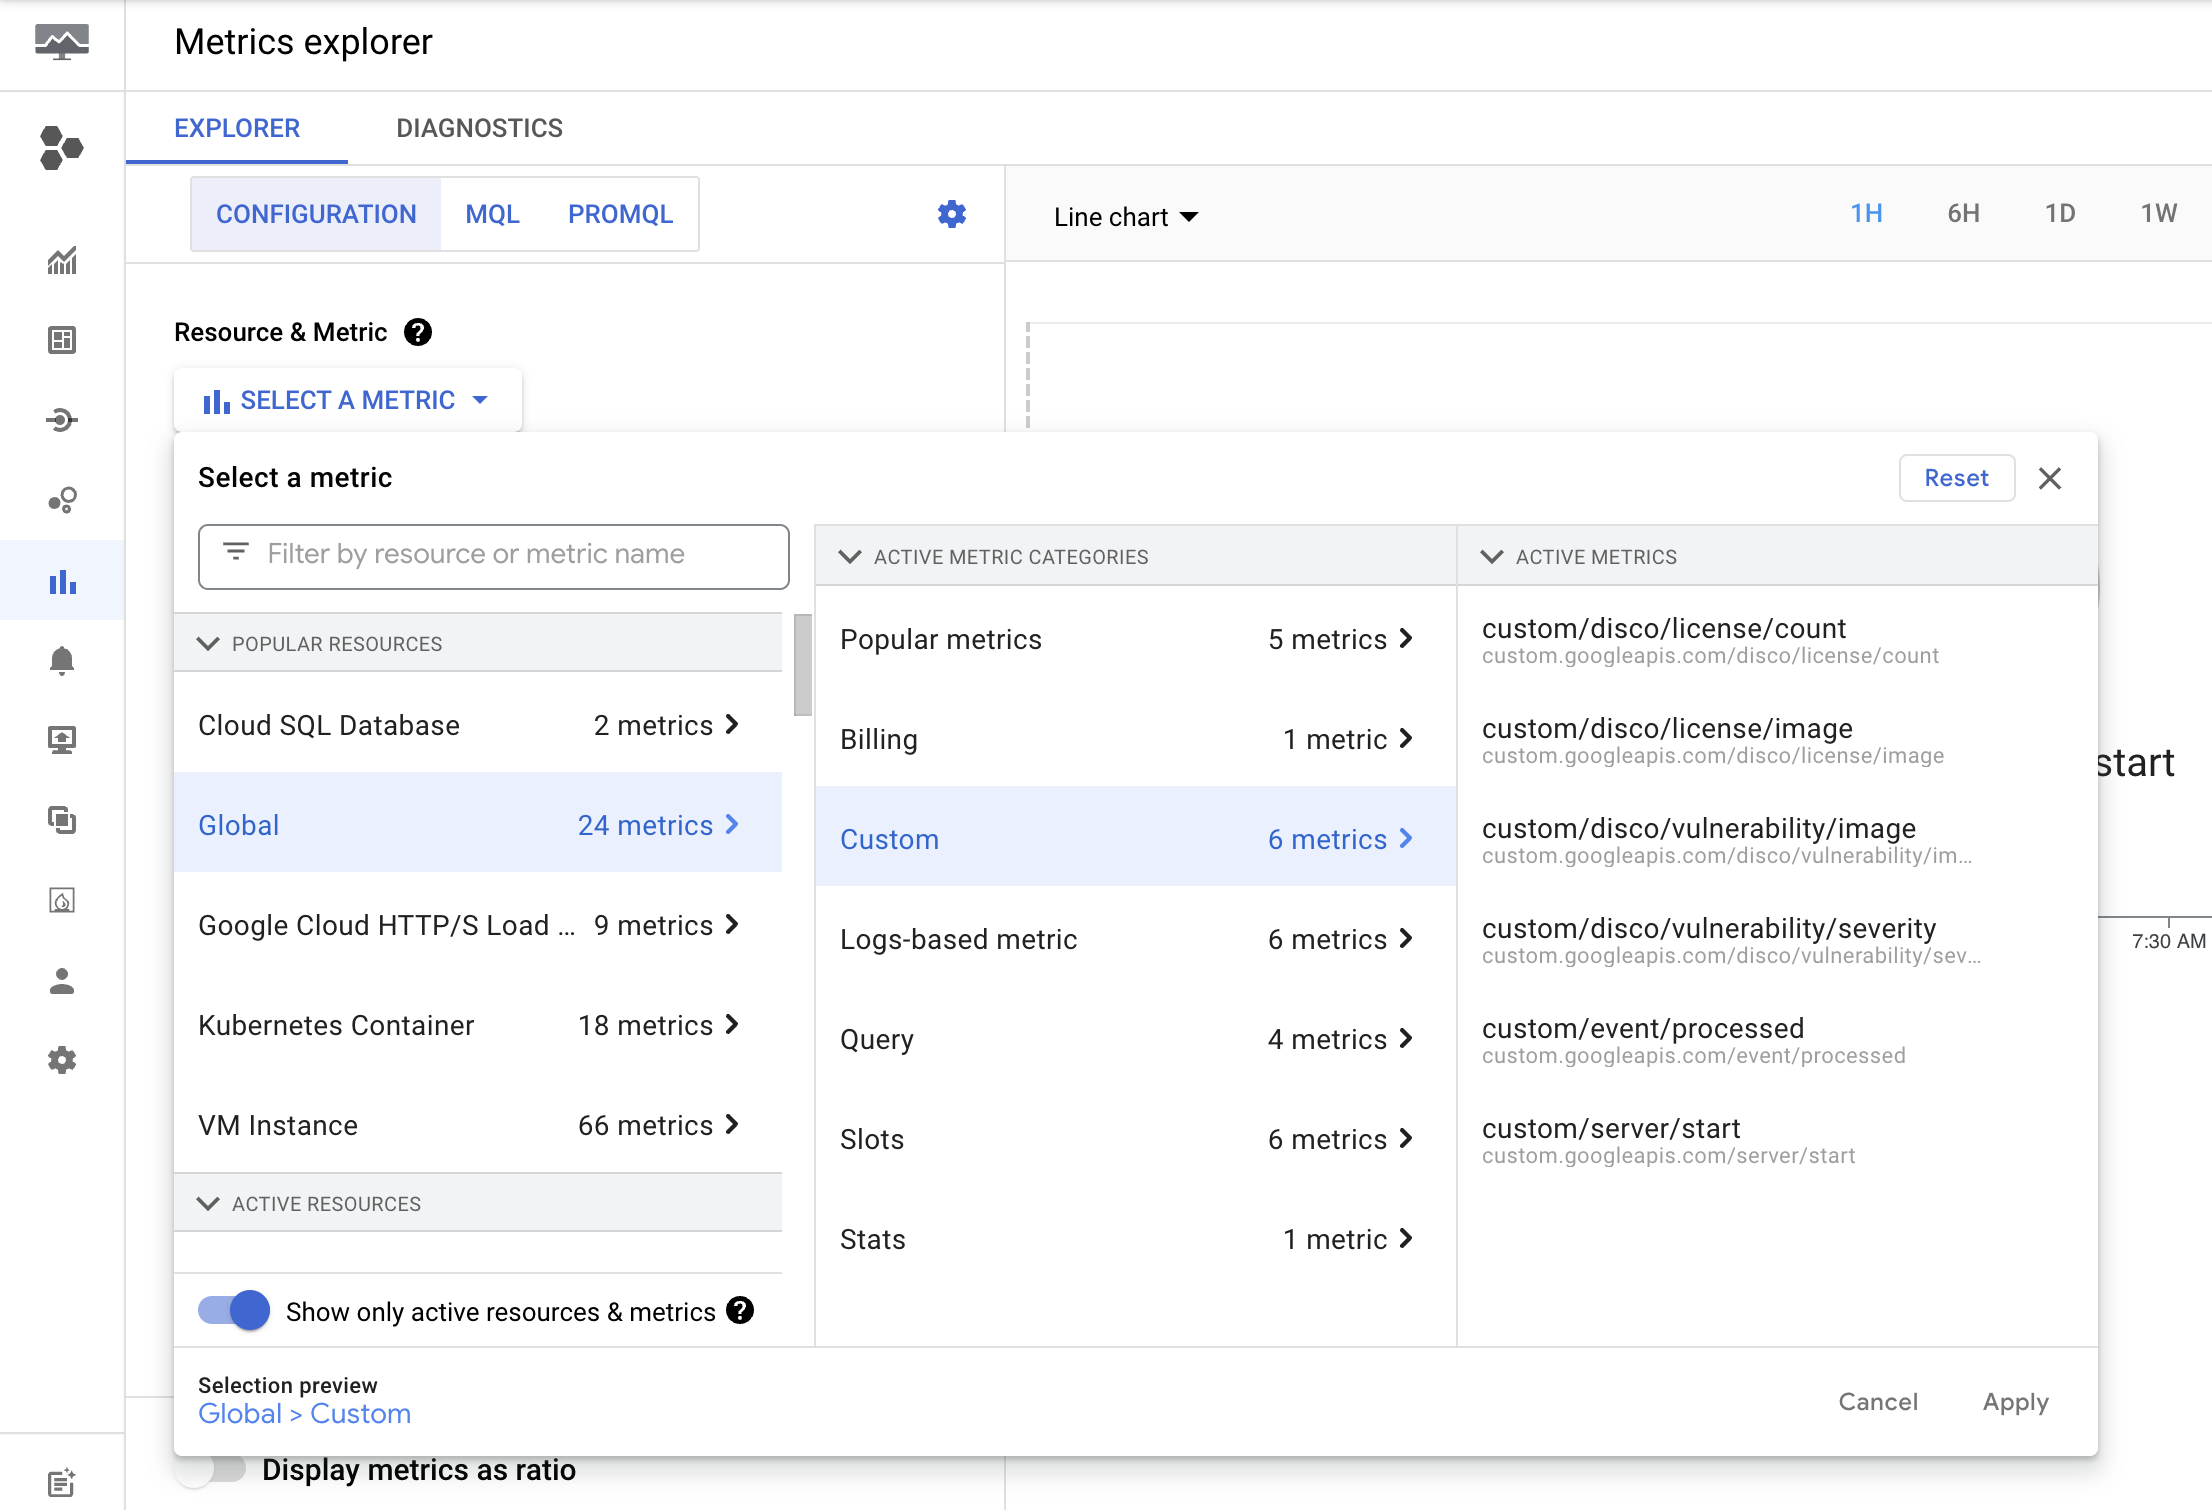
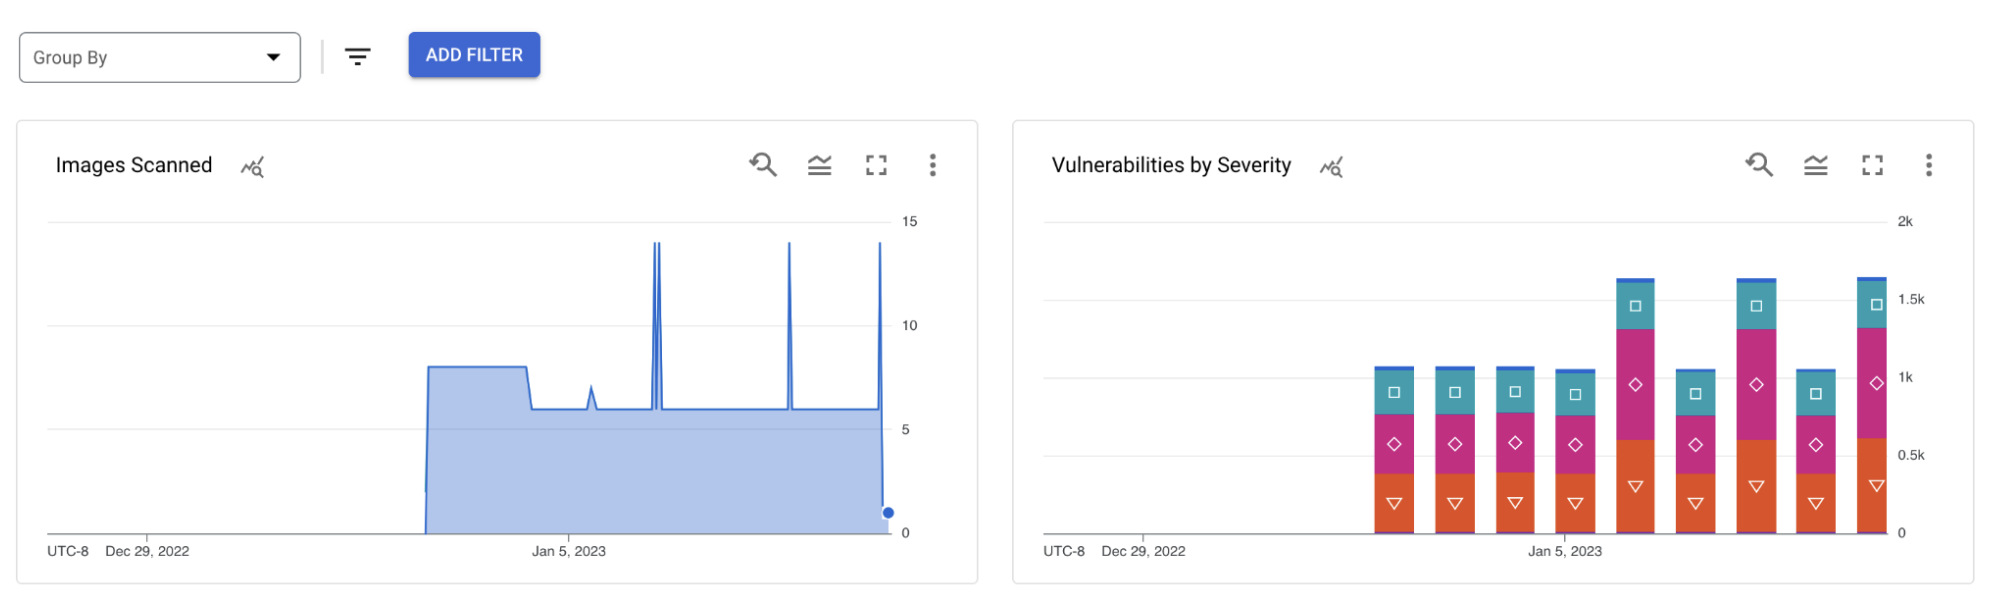
Once exported, I was able to use Metric Explorer to review the generated metrics:
I was also able to create notifications policies based on metric thresholds to alert using one of the supported channels (e.g. Mobile device app notification, Slack, Email, SMS, etc), and route the events to another process downstream using Pub/Sub (or Webhook).
At the end, only the severity metric turned out to be of significant value here. Packages, and licenses have way too high cardinality for individual metrics, and generic point metrics are fun for graphs, but I’m not sure anyone would actuate something on that (even when generalized, because there are at least ten diff ways to spell Artistic-2).
Forensic Analysis
Each of the data sources in disco (image, package, license, and vulnerability), has many data points, so for broader analysis over a longer period of time, disco also batch exports its data to BigQuery tables. The schema of each one of the tables is available here. To ensure the queries are performant over time regardless of volumes, disco partitions each table per day. More on partitioned tables here.
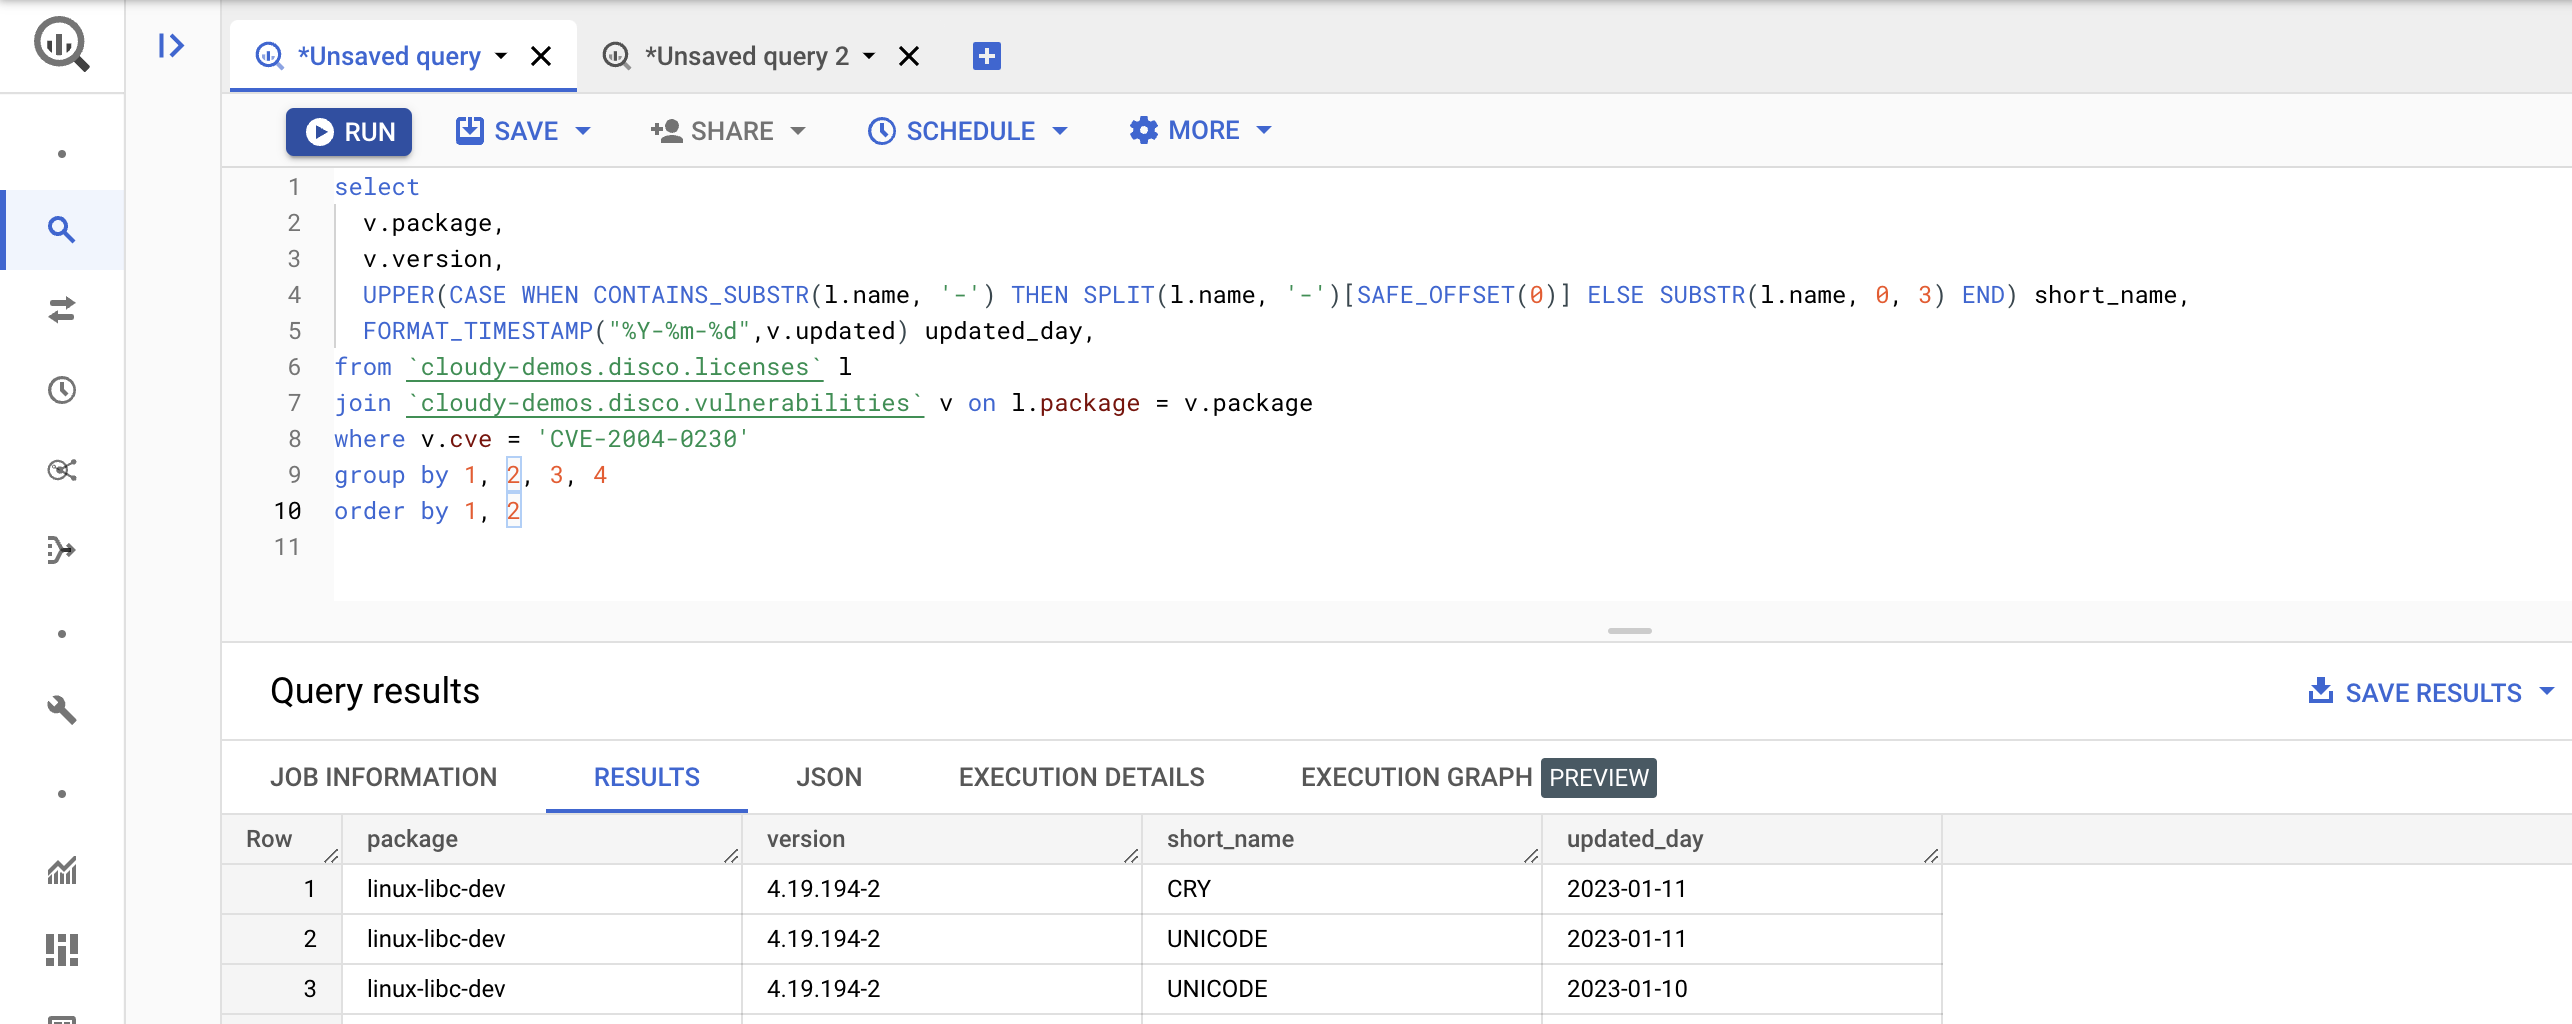
Once in BigQuery, I was able to use standard SQL to query over that data, using different joins across all the three main identities (license, package, vulnerability). I haven’t had the time to do it yet, but it would be interesting to combine the reports across different CVE sources like NVD or VULDB, to see how each reports CVEs over time. Using this setup, I was however able to identify a few interesting deviations over time. For example:
- Package version changes between versions, and cross-service distribution
- Vulnerability (CVE) severity and score changes
- Package license changes (yep, those do happen), see FOSSA
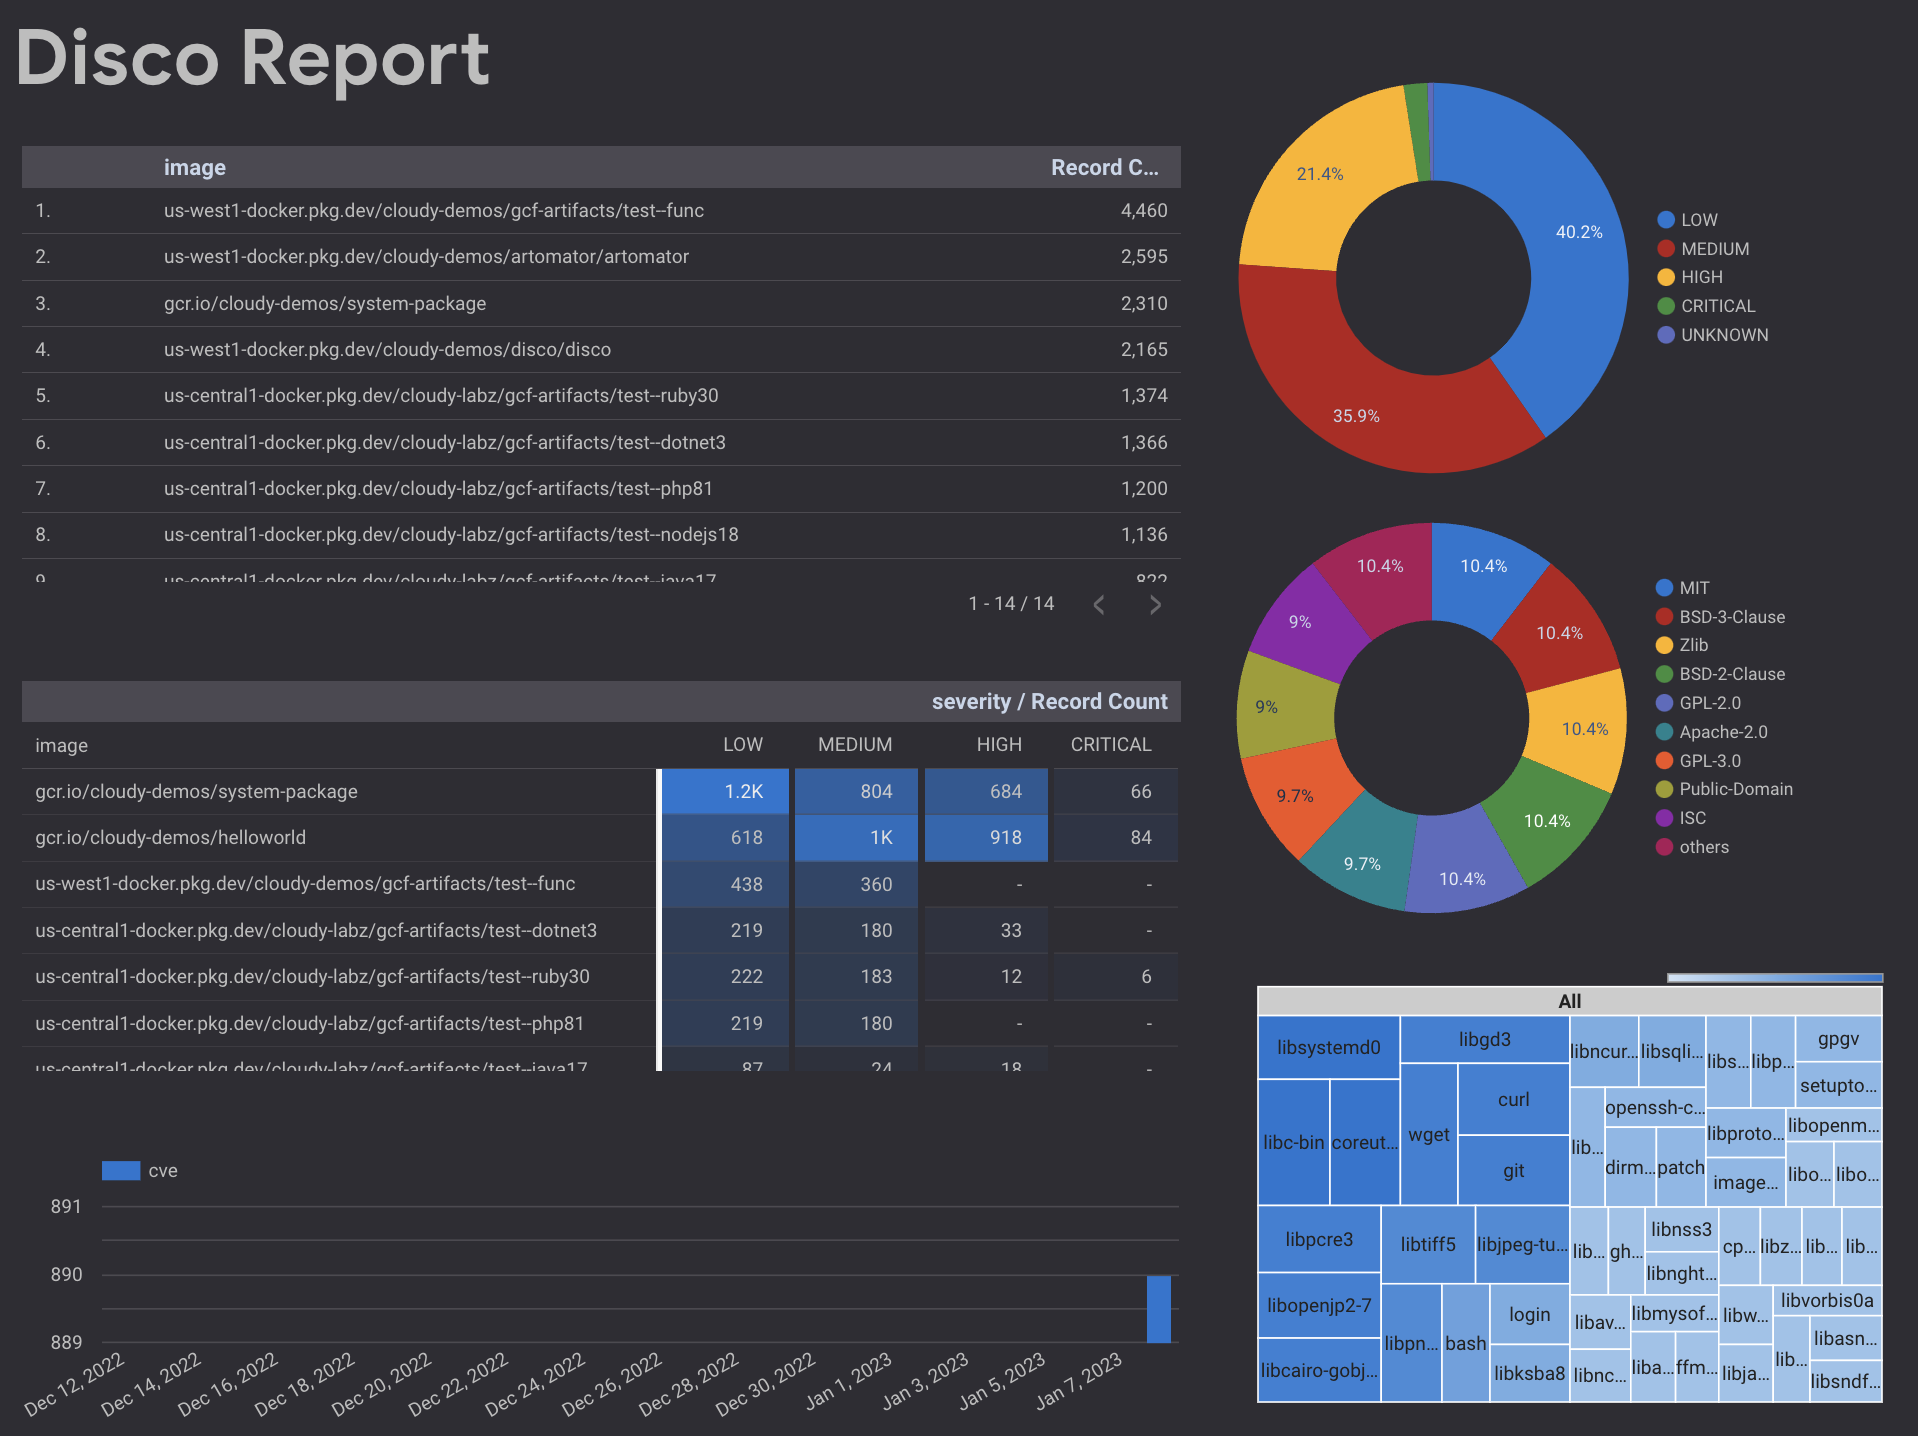
And because BigQuery has a rich ecosystem of visualization tools, I can also easily create reports from all this collected data like this one in Looker Studio which actually allows for drill-downs (select image and only its vulnerabilities, licenses, and package distribution).
In Summary
If nothing else, building disco was an educational experience. I gained appreciation for some of the idiosyncrasies in SBOM formats, I’ve learned about the different vulnerability data sources, and evaluated the tradeoffs in data aggregation and synthesis. This already happens in companies with more advanced SecOps, I do think, eventually, this data will more broadly drive policy decisions, be instrumental in audits, and used to manage risk. This data could also potentially drive better development practices. All in all, this is an exciting space with much, much more room for innovation. I look forward to digging deeper.
If you are interested, the disco source code, and Terraform-based deployment with prebuilt images, is available in my repo in github.com/mchmarny/disco. There also is a CLI you can use locally (installation instructions here). Hope you found this helpful.